Traducir el blog

Excel Unusual Engineering

Finding engineering work quite un-challenging lately I decided to start this blog in which to share cool ways of solving engineering problems or just interesting modeling of natural phenomena in MS Excel 2003. I use mainly cell formulas with minimum of VBA in order to take advantage of the native excel spreadsheet speed. Hi, I’m George Lungu, the admin of this blog. I do analog and mixed-signal electronics design and systems modeling for a living.

So begins the Excel Unusual blog, that just started to publish my friend Geo and certainly surprise more than one, starting with me.

Yesterday included his first three contributions and have left me wondering, also he attaches the files in Excel 2003 without hiding anything!

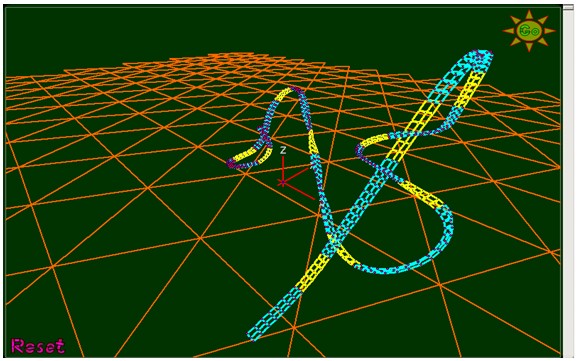
As just one example: A roller coaster in Excel 2003 created with a 2D scatter plot. Math formulas are in the spreadsheet with minimal macro code.


This is the original page of George Lungu, from where you can download this excellent "roller coaster":

ANIMATED ROLLER COASTER IN EXCEL

To start it click the little sun icon in the NE corner of the chart.

Ride on this roller coaster!

Traducción al español aquí.

Ingeniería en Excel Inusual

Como encontrar trabajo de ingeniería es bastante difícil últimamente, he decidido empezar este blog en el que compartir maneras interesantes de resolver problemas de ingeniería o de modelado de los fenómenos naturales en MS Excel 2003.  Yo uso principalmente fórmulas de las celdas con un mínimo de VBA con el fin de aprovechar la velocidad nativa de las hojas de cálculo de Excel.  Hola, soy George Lungu, el administrador de este blog. Hago diseño electrónico de señales analógicas y mixtas y modelado de sistemas electrónicos para ganarme la vida.

Así comienza el blog Excel Unusual que acaba de estrenar mi amigo Geo y que seguro que sorprenderá a más de uno, empezando por mí mismo.

Ayer incluyó sus tres primeras aportaciones y me han dejado maravillado además de adjuntar los archivos en Excel 2003 ¡sin ocultar nada!

Como muestra un botón: Una montaña rusa en Excel 2003 creada con un gráfico de dispersión en 2D. Las matemáticas están en las fórmulas de la hoja de cálculo con mínimo código en macro.


Esta es la página original de George Lungu, desde la que podrás descargar esta excelente "montaña rusa":

ANIMATED ROLLER COASTER IN EXCEL

Para iniciarlo, haz clic en el icono del Sol en la esquina NE de la carta.

¡Móntate ya en esta montaña rusa!

English translation of this post here.

How to make the Easter dates

In attempting to solve a problem, sometimes there are computations that make us as "Easter Bunnies" and there are very difficult to solve, if not impossible, or resolution continues endlessly. These computations can be formulas, functions, mathematical and computer algorithms, or from daily living such, as reaching end of the month!

In computer programs, software programmers always snuck Easter eggs, which are light jokes, like the calculator that allows Google "once in a blue moon", but sometimes become heavy when they are a result of our frequent calculation bugs...

Those who know me already know that I like the complicated calculations, and that the moon influences me by my zodiac sign, and I have also posted on this blog several calendars with the days religious and pagan holidays. The title says it very clear, How to make the Easter dates is about how to obtain the ecclesiastical calendar computation, ie, the set of calculations necessary to determine the date of Easter and other movable feasts, which are deducted from Easter Sunday.

During the Renaissance the calculation tables for Easter were based on the golden number. When calculating the date of Easter is called Computus in latin and has served for religious, astronomers, mathematicians, programmers and mental calculators rack their brains until these days.

Question is how to make the Easter dates, based on Gregorian computus, available to local Churches all over the world so that simultaneous commemoration would be, following the Gregorian Reform of the Calendar and do not ever coincide with the Jewish Passover, which takes place regardless of the day of the week.

This has led me to the collection of some of the algorithms for calculation of Easter Sunday (see here) its implementation in various programming languages and it is based on the first full moon of the spring. In the journal Science Today is an C++ algorithm and others in the book Mapping time: the calendar and its history by E. G. Richards.

As Excel is the spreadsheet for excellence, many algorithms have been developed based on VBA and formulas to get the Easter Sunday' dates and even a contest to create the shortest possible formula to obtain between 1900 and 2078, sponsored by Hans Herber, an Excel master in Germany.

The following attached Excel files are my own collection of algorithms for calculating the Easter Sunday for Western churches:

EasterSundayCalculation.xls 
(Formulas and UDF for Excel 2003 to 2010)
EasterSundayCalculation.xlsx 
(Formulas for Excel 2007 and 2010)
EasterSundayCalculation.zip 
(Formulas for Excel 2007 and 2010)

To do the comparison always the year is entered as 4-digit (YYYY) in cell A1.

In row 1 we get the Easter Sunday for each formula and User Defined Functions - UDF.

In rows 10-2029 appears the calculation of Easter Sunday for years 1900 to 4099, respectively.

Known limitations of Excel forbid to calculate the dates for previous Gregorian years, from 1583 to 1899.

NOTE: Excel for Windows uses the 1900 date system and Excel for Macintosh uses the 1904 date system.

You can view and download Easter computations from the Microsoft OneDrive cloud. From here without leaving the blog:


VBA Functions:

The most recognized algorithm is from the United States Naval Observatory - USNO and it was created by J.-M. Oudin.

Gets the count of all the Sundays of Easter for the Gregorian calendar from 1583 until 4099, although the range begins in 1900 for Excel:
Write this in any cell:
=EasterUSNO(A1)

Another algorithm slightly longer is the one created by Greg Mallen according to studies and tables of Ronald W. Mallen:
Called with:
=EasterDate(1,1,A1)

A considerably shorter one its quoted on Cheap Pearson website:

Finally I've included a function that fails more than the original formula which is based and which was proposed by Norbert Hetterich for the contest mentioned above.

Excel Formulas:

The formulas that support these algorithms are found on the Web in English and German, in its original version, and are translated here to English to enjoy them.

Thomas Jansen asked this curious formula that works between years 1900 and 2203:

Another version from Tomas Jansen:

I recommend using this version transformed into international date format:

Norbert Hetterich suggested the following but it fails in the year 2079:

I recommend using this version transformed into international date format:

Finally, I've obtained the next megaformula based on Greg Mallen and Ronald W. Mallen algorithms:

This last Megaformula is written in Excel 2007 and 2010 versions because it is not possible to write so large formulas in Excel 2003.

Now just I need help understanding these calculations!
Please, post a comment if you can help me.

PD: What has this to do with Graphical User Interfaces? That the information and results provided must be accurate and repeatable, as Easter dates...

Traducción al español aquí.

Cómputos que hacen la "Pascua"

Al intentar resolver un problema, a veces hay cómputos que nos hacen la "Pascua" y que nos resultan muy difíciles de resolver, si no imposibles, o se prolonga su resolución interminablemente. Estos cómputos pueden ser fórmulas, funciones, algoritmos matemáticos, informáticos o de la vida diaria, como ¡llegar a fin de mes!

En los programas de ordenador, los informáticos colamos siempre huevos de Pascua, que son ligeras bromas, como las que permite la calculadora de Google "once in a blue moon", pero a veces se convierten en pesadas cuando son resultado de nuestros frecuentes errores de cálculo...

Los que me conocéis ya sabéis que me gustan los cálculos complicados, y que la luna me influye por mi signo zodiacal, y que además he publicado en este blog varios calendarios con los días señalados de fiesta religiosas y paganas. El titular lo dice muy claro, con Cómputos que hacen la "Pascua" se trata de cómo obtener el cómputo eclesiástico, o sea, el conjunto de cálculos necesarios para determinar el día de la Pascua de Resurrección y demás fiestas movibles, que se deducen del Domingo de Pascua.

Durante el Renacimiento las tablas de cálculo para la Pascua se basaban en el número áureo. Al cálculo de la fecha de Pascua se le llama en latín Computus y ha servido para que religiosos, astrónomos, matemáticos, calculadoras humanas y programadores se devanen los sesos hasta nuestros días.

La cuestión es cómo hacer que las fechas de Pascua, basadas en el cómputo gregoriano, estén disponibles en todas las Iglesias Occidentales del mundo para que pueda celebrarse su conmemoración simultánea siguiendo la Reforma del Calendario Gregoriano y que no coincidan nunca con la Pascua judía, que se celebra independientemente del día de la semana.

Todo ello me ha llevado a la recopilación de algunos de los algoritmos de Cálculo del Domingo de Pascua - ver aquí su implementación en varios lenguajes de programación (Easter Sunday en inglés) ya que se basa en la primera luna llena o plenilunio de la primavera boreal.  En la revista Ciencia Hoy se ve un algoritmo en C++ y otros en el libro Mapping time: the calendar and its history de E. G. Richards.

Como Excel es la hoja de cálculo por excelencia, se han desarrollado muchos algoritmos basados en VBA y en fórmulas para obtener la Fecha o el Domingo de Pascua y hasta un concurso para crear la fórmula más corta posible que lo obtenga entre los años 1900 y 2078, patrocinado por Hans Herber, un maestro Excel en Alemania.

En los siguientes ficheros Excel adjunto mi propia recopilación de algoritmos de cálculo del Domingo de Pascua para las Iglesias Occidentales:

EasterSundayCalculation.xls 
(Fórmulas y UDF para Excel 2003 a 2010)
EasterSundayCalculation.xlsx 
(Fórmulas para Excel 2007 y 2010)
EasterSundayCalculation.zip 
(Los dos ficheros anteriores comprimidos)

En esta comparativa se introduce siempre el año como 4 dígitos (AAAA) en la celda A1.

En la fila 1 se obtienen los Domingos de Pascua para cada una de las fórmulas y llamadas a las funciones definidas por el usuario (User Defined Functions - UDF).

En las filas 10 a 2029 aparece el cálculo del Domingo de Pascua para los años 1900 al 4099, respectivamente.

Las limitaciones conocidas de Excel con las fechas impiden calcularlos para años gregorianos anteriores, desde 1583 al 1899.

NOTA: Excel para Windows utiliza el sistema de fechas 1900 y Excel para Macintosh utiliza el sistema de fechas 1904.

Puedes ver y descargar los cómputos que hacen la Pascua desde la nube de Microsoft OneDrive. Desde aquí sin salir del blog:


Funciones VBA:

El algoritmo más preciso reconocido procede del United States Naval Observatory - USNO y lo creó J.-M. Oudin.

Obtiene el cómputo de todos los domingos de Semana Santa para el Calendario Gregoriano, desde el año 1583 hasta el año 4099, aunque para Excel el rango empieza en 1900:
Se llama en una celda cualquiera con:
=EasterUSNO(A1)

Otro algoritmo un poco más largo es el creado por Greg Mallen según los estudios y tablas de Ronald W. Mallen:
Llamarlo con:
=EasterDate(1;1;A1)

Uno bastante más corto citado por Cheap Pearson en su web es:

Por último incluyo una función que falla más que la fórmula original en la que se basa y que fue propuesta por Norbert Hetterich para el concurso mencionado arriba.

Fórmulas Excel:

Las fórmulas que soportan estos algoritmos se encuentra en la Red en inglés y alemán, en su versión original, y las traduciré al español para poder disfrutarlas.

Thomas Jansen planteó esta curiosísima fórmula que funciona entre los años 1900 y 2203:

Otra versión de Tomas Jansen:

Aconsejo usar esta versión transformada en formato de fechas internacional:

Norbert Hetterich propuso la siguiente pero falla en el año 2079:

Aconsejo usar esta versión transformada en formato de fechas internacional:

Por último, la siguiente megafórmula la he obtenido de la función de Greg Mallen a partir del algoritmo de Ronald W. Mallen:

Esta última megafórmula está en la versión de Excel 2007 y 2010 pues no se soportan fórmulas tan largas en Excel 2003.

¡Ahora si que necesito ayuda para entender estos cálculos!
Por favor, escríbeme un comentario si puedes ayudarme.

P.D.: ¿Qué tiene que ver esto con los Interfaces Gráficos de Usuario? Que la información y los resultados aportados deben ser precisos y repetibles, como los cálculos de los días de Semana Santa...

English translation of this post here.

Gantt Chart with risk scenarios

I will not talk about the economic risk scenarios, because politicians and managers are for this, but we should be aware that, for a project to be successful, it must define its objectives with measurable and SMART criteria:
  • S: Specific
  • M: Measurable
  • A: Accurate
  • R: Realistic
  • T: Time bound
For the Technical Project Management it is used one or more of the following techniques for stimating time:
  • Experts's estimation: Trial based on their experience.
  • Similar estimation (Top-Down): Comparison with similar projects already completed.
  • Parametric estimation: workload * productivity.
  • Three points estimation: Media of the pessimistic, optimistic and realistic values.
  • Simulated estimation: Simulation using software tools.
In any estimate we must be able to measure the potential risk of failure to complete assignments on time, through a range of error. If we do not have previous experience on similar projects or we don't have measures of productivity, the estimation should be done according to the optimistic, realistic and pessimistic scenarios set by the project leader, always advised by his team collaborators.

All planning must have a risk plan and, to make it, a Gantt Chart could be a great help with three possible scenarios: Optimistic, Realistic and Pessimistic, including a different start date for each of these scenarios, according to the Critical Path Method, and that the starting date of each task depends on the date of completion of all its predecessor tasks.


With this program you can do a simulation exercise to measure the three possible scenarios for a project, with various estimates of onset and duration of tasks, to study its evolution over time and likely end dates. Monte Carlo is the most common technique of simulation. The bars of the Gantt charts are used to show the temporal overlapping of tasks.

The Project Management Plan should contain the document Time-scale Base, with the initial planning of the project times, to be compared with the actual project schedule.

I do not like to calculate the time estimation (TE) of each task with the formula:
TE = (O + 4M + P) / 6
shown in this example of Wikipedia, where:
O: The optimistic estimated time,
M: The normal or more frequent estimated time,
P: The pessimistic estimated time.

It is best to get three possible scenarios: best, planned and worst to improve them and to approach the target dates of the project.

In the next Excel sheet I have tried to capture this for an example of Gantt Chart that demonstrates the project management in real time, on any of the scenarios that are presented in order to assist in making decisions that serve to meet the targets set for the project.

pedrowave-gantt-chart.xlsx


The file is written for Excel 2007-2010 and includes Languages sheet that lets you add more languages for internationalization, as well as Spanish and English by selecting the cell B1.

I explain in the next video how to modify the tasks of the Gantt Chart:


If you are interested, Jon Peltier has published an Easier Gantt Chart for Repeated Tasks here.

I hope your comments and suggestions, and the results of your checks, that will help me improve the Gantt Chart, which I thank you in advance.

Traducción al español aquí.

Diagrama de Gantt con escenarios de riesgo

No voy a tratar los escenarios de riesgo económico porque para eso están los políticos y los gestores pero hay que saber que, para que un proyecto tenga éxito, deben definirse sus objetivos con criterios cuantificables e inteligentes, o sea SMART:
  • S: Specific (Específicos)
  • M: Measurable (Medibles)
  • A: Accurate (Precisos)
  • R: Realistic (Realistas)
  • T: Time bound (Temporales)
Para la Planificación de Proyectos (nebrija.es) se emplean una o varias de las siguientes técnicas de estimación de tiempos:
  • Estimación de expertos: Juicio en base a su experiencia.
  • Estimación análoga (Top-Down): Comparación con proyectos similares ya finalizados.
  • Estimación paramétrica: Cantidad de trabajo * productividad.
  • Estimación a tres puntos: Media del valor pesimista, optimista y más probable o realista.
  • Estimación simulada: Simulación mediante herramientas informáticas.
En toda estimación se debe poder medir el riesgo posible de no finalizar a tiempo las tareas, por medio de un rango de error. Si no se cuenta con experiencia anterior ni proyectos similares ni medidas de productividad, se debe hacer la estimación según los escenarios optimista, realista y pesimista marcados por el jefe del proyecto, siempre asesorado por su equipo colaborador.

Toda planificación debe contar con un plan de riesgos y, para elaborarlo, es de gran ayuda un Diagrama de Gantt con los 3 Escenarios posibles: Optimista, Realista y Pesimista que incluya una fecha de comienzo distinta para cada uno de los escenarios, según el Método del Camino Crítico, y que la fecha de comienzo de cada tarea dependa de la fecha de finalización de todas sus tareas predecesoras .


Con este programa se puede hacer una simulación consistente en calcular los 3 posibles escenarios de un proyecto, con distintas estimaciones de comienzo y de duración de las tareas, para estudiar su evolución en el tiempo y sus fechas finales probables. Monte Carlo es la técnica más común de simulación. Las barras de los Diagramas de Gantt se utilizan para mostrar los solapamientos temporales de las tareas.

El Plan de Gestión del Proyecto debe contener el documento Línea Base de Tiempo, con la planificación inicial de tiempos del proyecto, que se comparará con el cronograma real del proyecto.

A mí no me gusta calcular el tiempo estimado (TE) de cada tarea con la fórmula:
TE = (O + 4M + P) / 6
que aparece en este ejemplo de Wikipedia, siendo:
O: El tiempo estimado optimista,
M: El tiempo estimado más frecuente o normal,
P: El tiempo estimado pesimista.

Por eso es mejor obtener 3 escenarios posibles: el mejor, el planificado y el peor para poder mejorarlos y acercarse a las fechas objetivo del proyecto.

En la siguiente hoja en Excel he intentado plasmar lo anterior para obtener un ejemplo de Diagrama de Gantt que pueda servir para la gestión de proyectos en tiempo real, en cualquiera de los escenarios que se presenten, para poder ayudar en la toma de decisiones que sirvan para cumplir los objetivos establecidos para el proyecto.

Descarga el fichero desde el icono (Google Drive) o desde el enlace (Microsoft OneDrive)

pedrowave-gantt-chart.xlsx


El fichero está escrito para Excel 2007-2010 e incluye la hoja Languages que permite añadir más idiomas para su internacionalización, además del español e inglés, seleccionándolos en la celda B1.

En el siguiente vídeo explico como modificar las tareas de este Diagrama de Gantt:


Si estás interesado, Jon Peltier ha publicado un Fácil Diagrama de Gantt para Tareas Repetidas aquí

Espero vuestros comentarios y sugerencias, así como los resultados de vuestros chequeos, que me ayudarán a mejorar el Diagrama de Gantt, lo que os agradezco de antemano.

English translation of this post here.

Graphical Project Planning

Any project should have marked targets that must be planned and divided into several tasks and, during development, do tracking to meet the deviations that occur and take appropriate decisions to have it under control.

To successfully complete a project have to meet its initial objectives (not to mention the changes that arise during the phases of the project due to changes by customers, test users, development team, project managers, potential market, etc..) and one of the main objectives is to meet the originally scheduled completion date, usually imposed by customers.

A good help is to represent the project tasks so that can change the scenarios at any time knowing what is been done and what remains to be done to allocate more or less time before there is risk to meet the objectives.

If you don't have MS Project you can use MS Excel to build a Gantt Chart with many of its features if you read this topic and begin this September with good intentions and projects.


The Gantt Charts usually don't consider anything more than a scenario but this provides 3 scenarios or possible cases:
  • Optimistic (best case): with optimal time of shorter duration historic of tasks.
  • Realistic (scheduled case): with the modal duration time of greater historical frequency of tasks.
  • Pessimistic (worst case): with the worst time, that is the longest historical duration of tasks.
Besides, of course, being able to change the names of tasks, cells that can be modified are marked with yellow background color:
C4 - Percent for the optimistic scenario.
C5 - Percentage for the realistic scenario.
C6 - Percent for the pessimistic scenario.
O9 - Scheduled starting date of the project.
F9 a F20 - Initial duration of each task scheduled on weekdays.
W9 a W20 - Actual dates of completion of tasks.
X9 a X20 - Days to be added at the end of a task to start the next task.
D10 a D20 - Predecessor tasks of each task, separated by commas.

The different scenarios of the Gantt Chart are selected through dropdown list in the next cells:
O2 - Gantt o Scenarios of the Gantt Chart.
O7 - Optimistic, Realistic and Pessimistic with the 3 possible scenarios.

This model has been inspired by an idea of Chandoo: Gantt Box Chart Tutorial

Download from this post the file with my proposal version in Excel:
Gantt Chart with risk scenarios | #ExcelPedroWave

Traducción al español aquí.

Planificación Gráfica de Proyectos

En todo proyecto se deben marcar unos objetivos que han de ser planificados y divididos en varias tareas y, durante su desarrollo, hacer un seguimiento para conocer las desviaciones que ocurran y tomar las decisiones adecuadas para tenerlo bajo control.

Para que un proyecto finalice con éxito se han de cumplir sus objetivos iniciales (sin olvidar las modificaciones surgidas durante las fases del proyecto debidas a variaciones por parte de los clientes, de los usuarios de test, del equipo de desarrollo, de los jefes de proyecto, del mercado potencial, etc.) y uno de los objetivos principales es cumplir con la fecha de finalización prevista inicialmente, normalmente impuesta por los clientes.

Una buena ayuda es representar gráficamente las tareas del proyecto de modo que se puedan variar los escenarios posibles sabiendo en todo momento lo que está hecho y lo que falta por hacer para poder asignar más o menos recursos a tiempo antes de que haya riesgos de cumplir sus objetivos.

Si no dispones de MS Project puedes emplear MS Excel para construir un Diagrama de Gantt con muchas de sus características leyendo este tema y para comenzar este mes de septiembre con buenos propósitos y proyectos.


Los diagramas de Gantt normalmente no tienen en cuenta nada más que un escenario previsto pero éste tiene 3 escenarios o casos posibles:
  • Optimista (mejor caso): con el tiempo óptimo de menor duración histórica de las tareas.
  • Realista (caso planificado): con el tiempo modal de duración de mayor frecuencia histórica de las tareas.
  • Pesimista (peor caso): con el peor tiempo, o sea la mayor duración histórica de las tareas.
Además de poder modificar los nombres de las tareas, por supuesto, se han marcado con fondo amarillo las celdas que pueden ser modificadas:
C4 - Porcentaje para el escenario optimista.
C5 - Porcentaje para el escenario realista.
C6 - Porcentaje para el escenario pesimista.
O9 - Fecha inicial prevista de comienzo del proyecto.
F9 a F20 - Duración inicial prevista de cada tarea en días laborables.
W9 a W20 - Fechas reales de finalización de las tareas.
X9 a X20 - Días a añadir al final de una tarea para comenzar la próxima tarea.
D10 a D20 - Tareas predecesoras de cada tarea separadas por comas.

Los diferentes escenarios del diagrama de Gantt se seleccionan mediante desplegables en las celdas:
O2 - Gantt o Escenarios del gráfico del diagrama de Gantt.
O7 - Optimista, Realista y Pesimista con los 3 escenarios posibles.

Este modelo está inspirado en una idea de Chandoo: Gantt Box Chart Tutorial

En este artículo puedes descargar el archivo con mi versión propuesta en Excel:
Diagrama de Gantt con escenarios de riesgo | #ExcelPedroWave

English translation of this post here.

Mi lista de blogs