I will not talk about the
economic risk scenarios, because politicians and managers are for this, but we should be aware that,
for a project to be successful, it must define its objectives with SMART criteria:
Experts's estimation: Trial based on their experience.
Similar estimation (Top-Down): Comparison with similar projects
already completed.
Parametric estimation: workload * productivity.
Three points estimation: Media of the pessimistic, optimistic and
realistic values.
Simulated estimation: Simulation using software tools.
In any estimate we must be able to measure the potential risk of failure to
complete assignments on time, through a range of error. If we do not have
previous experience on similar projects or we don't have measures of
productivity, the estimation should be done according to the optimistic,
realistic and pessimistic scenarios set by the project leader, always advised
by his team collaborators.
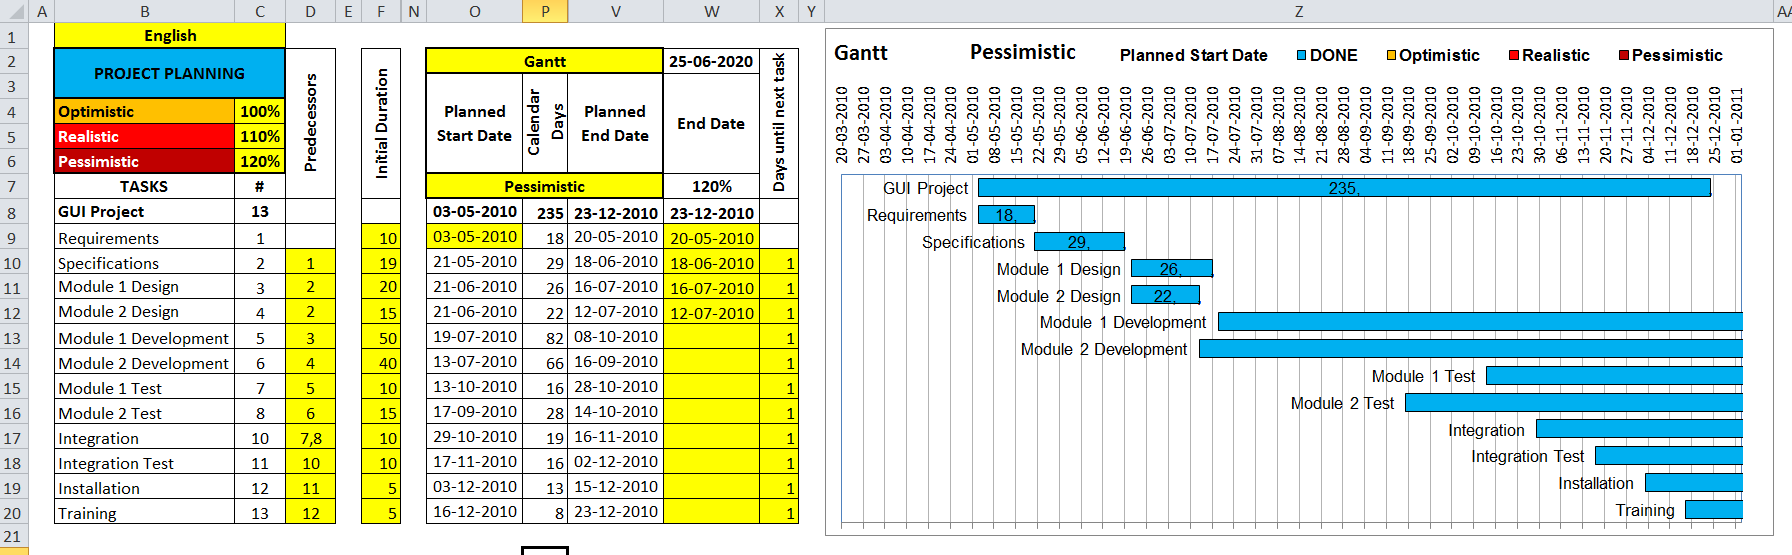
All planning must have a risk plan and, to make it, a Gantt Chart could be a great help with three possible scenarios: Optimistic,
Realistic and Pessimistic, including a different start date for each of these
scenarios, according to the Critical Path Method, and that the starting date of each task depends on the date of completion
of all its predecessor tasks.
With this program you can do a simulation exercise to measure the three
possible scenarios for a project, with various estimates of onset and duration
of tasks, to study its evolution over time and likely end dates. Monte Carlo is the most common technique of simulation. The bars of the Gantt
charts are used to show the temporal overlapping of tasks.
The Project Management Plan should contain the document Time-scale Base, with the initial planning of the project times, to be compared with the
actual project schedule.
I do not like to calculate the time estimation (TE) of each task with the
formula: TE = (O + 4M + P) / 6
shown in
this example of Wikipedia, where:
O: The optimistic estimated time,
M: The normal or more frequent estimated time,
P: The pessimistic estimated time.
It is best to get three possible scenarios: best, planned and worst to improve
them and to approach the target dates of the project.
In the next Excel sheet I have tried to capture this for an example of Gantt
Chart that demonstrates the project management in real time, on any of the
scenarios that are presented in order to assist in making decisions that serve
to meet the targets set for the project.
The file is written for Excel 2007-2010 and includes Languages sheet
that lets you add more languages for internationalization, as well as Spanish
and English by selecting the cell B1.
I explain in the next video how to modify the tasks of the Gantt Chart:
Dynamic array update and the @ operator
-
Many of the user defined functions (UDF’s) presented in this blog return an
array rather than a single value. Options for displaying arrays in Excel
have c...
Automatiza tareas con Power Automate de Microsoft
-
Automatiza tareas con Power Automate es facil usando esta herramienta de
Microsoft (dentro de Power Platform) puedes automatizar tareas repetitivas
para ...
Funciones definidas para tipos de números (3)
-
Esta entrada cierra el estudio de funciones definidas para ciertos tipos
de números, así como de sus funciones inversas. En esta tercera se
estudiarán l...
Build a Daily Events Calendar in Excel
-
Use my Excel events calendar to track meetings and events inside a
workbook. Add your upcoming events to a list, set a start date, and then
see those items...
Cómo hacer gráficos en Excel
-
Excel es una de las herramientas más potentes y versátiles para el análisis
y la presentación de datos. Los gráficos en Excel no solo ayudan a
visualizar...
Análisis DAFO (FODA, DOFA) las decisiones con Excel
-
Para conocer la situación de una empresa, proyecto o persona, recurrimos al
análisis DAFO (FODA, DOFA) en la toma de decisiones con Excel. El los años
sese...
How To Predict Bearing Life With Excel
-
When you work in mechanical engineering, understanding the reliability and
performance of bearings under various conditions is crucial. Bearings are
the co...
TikTok’s search evolution
-
2 in 5 Americans use TikTok as a search engine. Nearly 1 in 10 Gen Zers are
more likely to rely on TikTok than Google as a search engine. More than
half of...
Unblocking and Enabling Macros
-
When Windows detects that a file has come from a computer other than the
one you're using, it marks the file as coming from the web, and blocks the
file....
La importancia de saber mecanografía en 2022
-
[image: Resultado de imagen de mecanografía viñeta escribiendo a máquina]
Según la RAE, la mecanografía es el arte de escribir a máquina. Hace unos
cuantos...
London Excel Meetup Workbooks
-
The workbooks used in my presentation on “Analytical and Interactive
Dashboards in Excel” at the London Excel Meetup, September 3, 2020
International Keyboard Shortcut Day 2019
-
The first Wednesday of every November is International Keyboard Shortcut
Day. This Wednesday, people from all over the world will become far less
efficient...
Welcome, Prashanth!
-
Last March, I shared that we were starting to look for a new CEO for Stack
Overflow. We were looking for that rare combination of someone who… Read
more "W...
Salvador Sostres, analfabeto profesional
-
Los nuevos tiempos traen nuevas profesiones. Internet, además, ha
revolucionado el mundo del periodismo y la palabra escrita. Adaptarse o
morir, ese es el ...
Planificación de compras
-
Realizar una lista con los productos que necesitamos y que formarán parte
de nuestra cesta de la compra nos ayuda a *encontrar la combinación de
bienes p...
Mis metas son seguir superando nuevos retos en Excel y compartirlos en mi blog, para sacarle todo el poder a esta excelente herramienta multiusos, tan usada y a la vez tan incomprendida, para así poder mejorar nuestros conocimientos de Excel.


No Response to "Gantt Chart with risk scenarios"
Leave A Reply
Comenta este artículo, critícalo o avisa si detectas algún error que haya que corregir.