Any project should have marked targets that must be planned and divided into
several tasks and, during development, do tracking to meet the deviations that
occur and take appropriate decisions to have it under control.
To successfully complete a project have to meet its initial objectives
(not to mention the changes that arise during the phases of the project due
to changes by customers, test users, development team, project managers,
potential market, etc..)
and one of the main objectives is to meet the originally scheduled completion
date, usually imposed by customers.
A good help is to represent the project tasks so that can change the scenarios
at any time knowing what is been done and what remains to be done to allocate
more or less time before there is risk to meet the objectives.
If you don't have
MS Project you can use
MS Excel to build a
Gantt Chart with many of its features if you read this topic and begin this
September with good intentions and projects.

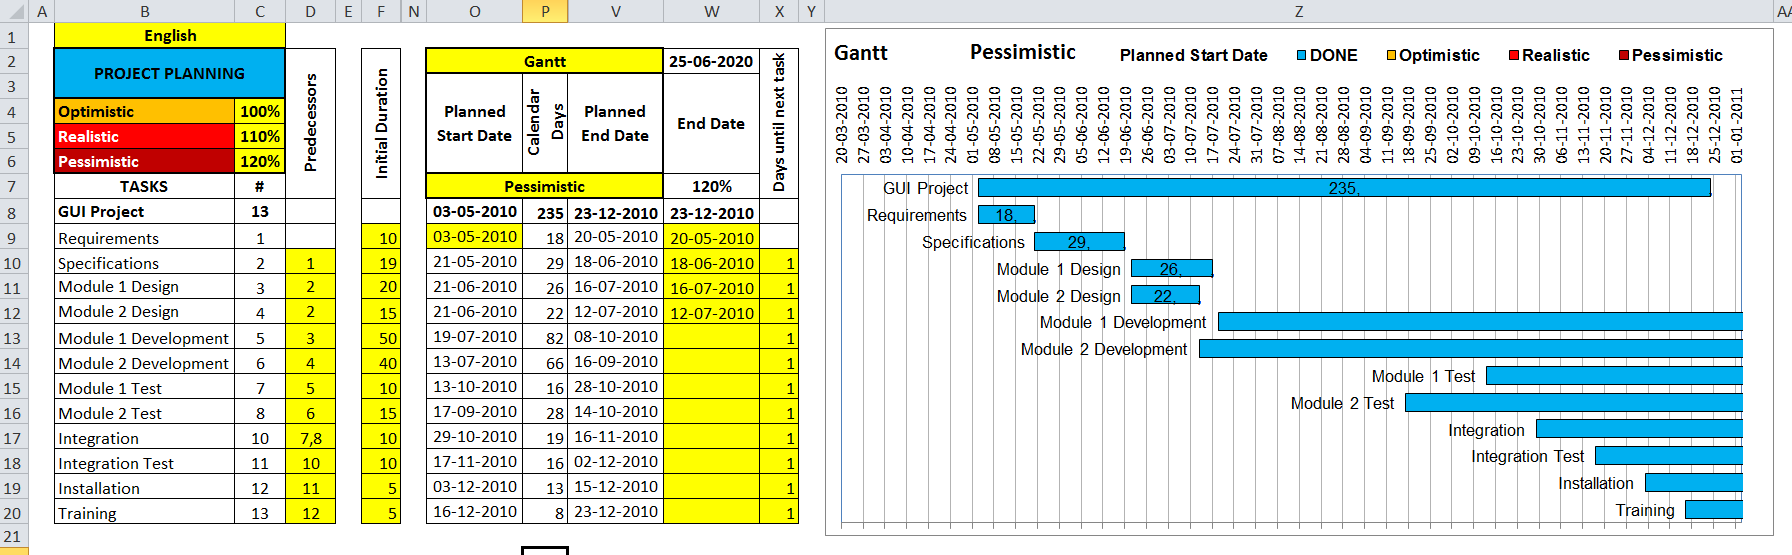
The Gantt Charts usually don't consider anything more than a scenario but this
provides 3 scenarios or possible cases:
-
Optimistic (best case): with optimal time of shorter duration
historic of tasks.
-
Realistic (scheduled case): with the modal duration time of greater
historical frequency of tasks.
-
Pessimistic (worst case): with the worst time, that is the longest
historical duration of tasks.
Besides, of course, being able to change the names of tasks, cells that can be
modified are marked with
yellow background color:
C4 - Percent for the optimistic scenario.
C5 - Percentage for the realistic scenario.
C6 - Percent for the pessimistic scenario.
O9 - Scheduled starting date of the project.
F9 a F20 - Initial duration of each task scheduled on weekdays.
W9 a W20 - Actual dates of completion of tasks.
X9 a X20 - Days to be added at the end of a task to start the next task.
D10 a D20 - Predecessor tasks of each task, separated by commas.
The different scenarios of the Gantt Chart are selected through dropdown list
in the next cells:
O2 -
Gantt o Scenarios of the Gantt Chart.
O7 -
Optimistic, Realistic and Pessimistic with the 3 possible
scenarios.
This model has been inspired by an idea of Chandoo:
Gantt Box Chart TutorialDownload from this post the file with my proposal version in
Excel:
Gantt Chart with risk scenarios | #ExcelPedroWave
Traducción al español
aquí.


No Response to "Graphical Project Planning"
Leave A Reply
Comenta este artículo, critícalo o avisa si detectas algún error que haya que corregir.