Traducir el blog

Graphical Project Planning

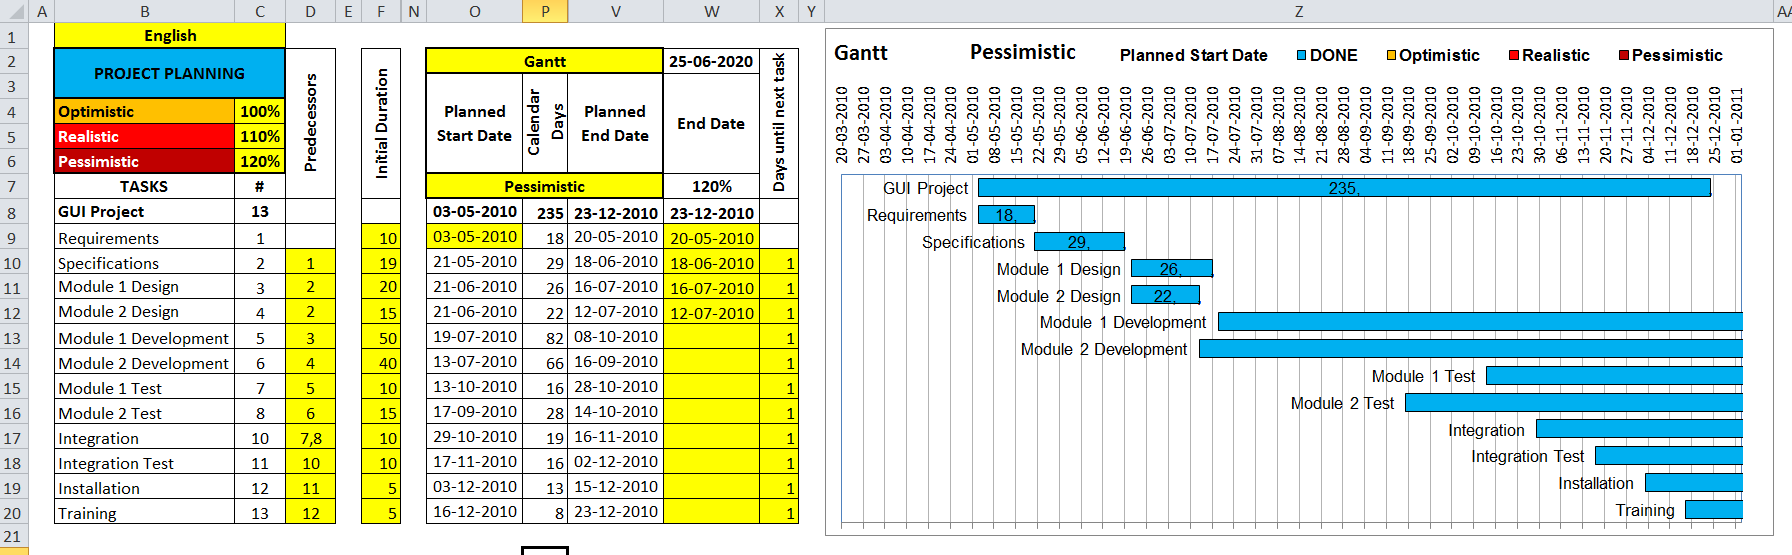
Any project should have marked targets that must be planned and divided into several tasks and, during development, do tracking to meet the deviations that occur and take appropriate decisions to have it under control.

To successfully complete a project have to meet its initial objectives (not to mention the changes that arise during the phases of the project due to changes by customers, test users, development team, project managers, potential market, etc..) and one of the main objectives is to meet the originally scheduled completion date, usually imposed by customers.

A good help is to represent the project tasks so that can change the scenarios at any time knowing what is been done and what remains to be done to allocate more or less time before there is risk to meet the objectives.

If you don't have MS Project you can use MS Excel to build a Gantt Chart with many of its features if you read this topic and begin this September with good intentions and projects.


The Gantt Charts usually don't consider anything more than a scenario but this provides 3 scenarios or possible cases:
  • Optimistic (best case): with optimal time of shorter duration historic of tasks.
  • Realistic (scheduled case): with the modal duration time of greater historical frequency of tasks.
  • Pessimistic (worst case): with the worst time, that is the longest historical duration of tasks.
Besides, of course, being able to change the names of tasks, cells that can be modified are marked with yellow background color:
C4 - Percent for the optimistic scenario.
C5 - Percentage for the realistic scenario.
C6 - Percent for the pessimistic scenario.
O9 - Scheduled starting date of the project.
F9 a F20 - Initial duration of each task scheduled on weekdays.
W9 a W20 - Actual dates of completion of tasks.
X9 a X20 - Days to be added at the end of a task to start the next task.
D10 a D20 - Predecessor tasks of each task, separated by commas.

The different scenarios of the Gantt Chart are selected through dropdown list in the next cells:
O2 - Gantt o Scenarios of the Gantt Chart.
O7 - Optimistic, Realistic and Pessimistic with the 3 possible scenarios.

This model has been inspired by an idea of Chandoo: Gantt Box Chart Tutorial

Download from this post the file with my proposal version in Excel:
Gantt Chart with risk scenarios | #ExcelPedroWave

Traducción al español aquí.

Planificación Gráfica de Proyectos

En todo proyecto se deben marcar unos objetivos que han de ser planificados y divididos en varias tareas y, durante su desarrollo, hacer un seguimiento para conocer las desviaciones que ocurran y tomar las decisiones adecuadas para tenerlo bajo control.

Para que un proyecto finalice con éxito se han de cumplir sus objetivos iniciales (sin olvidar las modificaciones surgidas durante las fases del proyecto debidas a variaciones por parte de los clientes, de los usuarios de test, del equipo de desarrollo, de los jefes de proyecto, del mercado potencial, etc.) y uno de los objetivos principales es cumplir con la fecha de finalización prevista inicialmente, normalmente impuesta por los clientes.

Una buena ayuda es representar gráficamente las tareas del proyecto de modo que se puedan variar los escenarios posibles sabiendo en todo momento lo que está hecho y lo que falta por hacer para poder asignar más o menos recursos a tiempo antes de que haya riesgos de cumplir sus objetivos.

Si no dispones de MS Project puedes emplear MS Excel para construir un Diagrama de Gantt con muchas de sus características leyendo este tema y para comenzar este mes de septiembre con buenos propósitos y proyectos.


Los diagramas de Gantt normalmente no tienen en cuenta nada más que un escenario previsto pero éste tiene 3 escenarios o casos posibles:
  • Optimista (mejor caso): con el tiempo óptimo de menor duración histórica de las tareas.
  • Realista (caso planificado): con el tiempo modal de duración de mayor frecuencia histórica de las tareas.
  • Pesimista (peor caso): con el peor tiempo, o sea la mayor duración histórica de las tareas.
Además de poder modificar los nombres de las tareas, por supuesto, se han marcado con fondo amarillo las celdas que pueden ser modificadas:
C4 - Porcentaje para el escenario optimista.
C5 - Porcentaje para el escenario realista.
C6 - Porcentaje para el escenario pesimista.
O9 - Fecha inicial prevista de comienzo del proyecto.
F9 a F20 - Duración inicial prevista de cada tarea en días laborables.
W9 a W20 - Fechas reales de finalización de las tareas.
X9 a X20 - Días a añadir al final de una tarea para comenzar la próxima tarea.
D10 a D20 - Tareas predecesoras de cada tarea separadas por comas.

Los diferentes escenarios del diagrama de Gantt se seleccionan mediante desplegables en las celdas:
O2 - Gantt o Escenarios del gráfico del diagrama de Gantt.
O7 - Optimista, Realista y Pesimista con los 3 escenarios posibles.

Este modelo está inspirado en una idea de Chandoo: Gantt Box Chart Tutorial

En este artículo puedes descargar el archivo con mi versión propuesta en Excel:
Diagrama de Gantt con escenarios de riesgo | #ExcelPedroWave

English translation of this post here.

History of the first alphanumeric displays

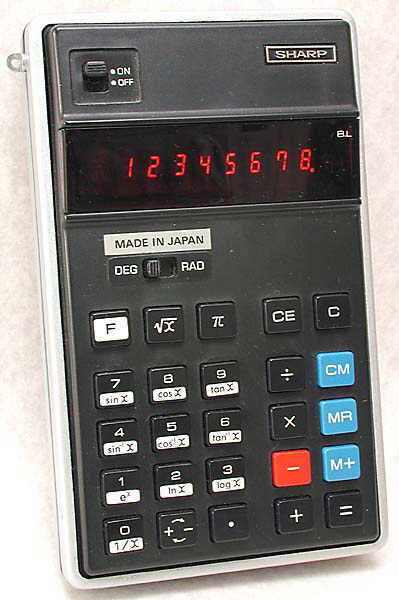
I remember my parents bought me in 1974 my first pocket calculator, a Japanese SHARP PC-1801 with square roots and scientific functions with a size of 94x148x36mm / 3.7x5.8x1.4 ", a weight of 350 grams and consumption 1.3 W supplied by 5 AA batteries.

To visualize the results the calculator has, yes it has because I still have it and works!, an 8-digit numeric display, each consisting of a 7-segment display, type LED of 5mm/0.2 red, as seen in the photo of the calculator.

The LED displays consumed much 40 years ago and were replaced by LCD displays with less consume, being curious that although they have nothing to do with the current flat TV screens, LED technology was replaced by the LCD during the first display war, unlike today.

As a 7-segment displays were designed to represent hexadecimal numbers (0-9 and A-F) to represent alphanumeric characters appeared 14-segment displays and arrays of 4x7 and 5x7 LEDs, of which I will not talk in this article because they are more sophisticated and appeared later.

A game known as calculator spelling, with 7-segment displays, was to write numbers and see them putting the calculator upside down to form phrases with the letters of the alphabet, as the number 0 becomes the letter O, 1 to L, 2 to Z, 3 to E, 4 to h, 5 to S, 6 to G, 7 to T, 8 to B and 9 to P, this technique was being used as a slang (Alphabet 1337 - Leet speak) by the elite of programmers, geeks and phone hackers, to avoid censorship in the first chats (BBS) that existed in the Internet-80s. You can find a translator Leet here.

These holidays I plan to design an Excel spreadsheet that can visualize, with a 7-segment displays, any phrase you enter in alphanumeric mode and a clock with hours, minutes and seconds.


The result is an Excel 2010 sheet with macros to get the animation of the clock, refreshed every second, and the shift to the left of the words of the sentence written in cell E27 (yellow). In cell A29 you can write the number of characters you want to shift to the left each time.

Hit the play button to begin to see the numbers and letters with 7-segment display green or red better!

We are with the Red!
The Spanish team in the final World Cup South Africa 2010!

If you like it, you can download the file from the following forum link AyudaExcel:

or from my public disk Google Drive:


Traducción al español aquí.

Historia de los primeros displays alfanuméricos

Recuerdo que mis padres me compraron en 1974 mi primera calculadora de bolsillo, una SHARP PC-1801 japonesa, con raíces cuadradas y funciones científicas, con un tamaño de 94x148x36mm / 3.7x5.8x1.4", un peso de 350 gramos y un consumo de 1,3 W suministrado por 5 pilas AA.

Para visualizar los resultados dispone ¡sí dispone porque aún la tengo y funciona! de un pantalla de 8 dígitos numéricos, cada uno formado por un display de 7 segmentos del tipo LED rojo de 5mm/0.2", como se puede apreciar en la foto de la calculadora.

Los displays LED de hace 40 años consumían mucho y fueron sustituidos por los displays LCD que consumían menos, siendo curioso que aunque no tienen nada que ver con la pantallas de TV planas actuales, la tecnología LED fue sustituida por la LCD durante la primera guerra de los displays, al revés que hoy en día.

Como los displays de 7 segmentos estaban diseñados para representar números hexadecimales (0-9 y A-F), para representar caracteres alfanuméricos aparecieron displays de 14 segmentos y matrices de 4x7 y 5x7 LEDs, de los que no hablaré en este artículo porque son más sofisticados y aparecieron más tarde.

Un juego conocido como ortografía de la calculadora, con displays de 7 segmentos, era escribir números y verlos colocando la calculadora al revés para formar frases con las letras del alfabeto, ya que el número 0 se convierte en la letra O, 1 en L, 2 en Z, 3 en E, 4 en h, 5 en S, 6 en G, 7 en T, 8 en B y 9 en P, siendo usada esta técnica como una jerga (Alfabeto 1337 - Leet speak) por la élite de los programadores geeks y los hackers telefónicos, para evitar la censura en los primeros chats (BBS) que existieron en el Internet de los años 80.  Puedes ver un traductor Leet aquí.

Estos días de vacaciones me he propuesto diseñar una hoja de cálculo Excel que pueda visualizar, con displays de 7 segmentos, cualquier frase que se introduzca en modo alfanumérico y un reloj con sus horas, minutos y segundos.


El resultado es una hoja Excel 2010 con macros para conseguir la animación del reloj, refrescándolo cada segundo, y el desplazamiento hacia la izquierda de las palabras de la frase escrita en la celda E27 (en amarillo).  En la celda A29 se escribe el número de caracteres que queramos que salte el desplazamiento.

Dale al botón del play para comenzar a visualizar los números y las letras con display de 7 segmentos de color verde o mejor ¡rojo!.

¡Estamos con la Roja!
¡La Selección Española en la final del Mundial de Fútbol de Sudáfrica 2010!

Si te gusta puedes descargarte el fichero desde el siguiente enlace del foro de AyudaExcel:

o desde mi disco público Google Drive:


English translation of this post here.

How to get World Cup goals

How to get World Cup goals?

With the collaboration tools in the cloud can get World Cup goals in a spreadsheet and share it with everyone.

The fullest collaboration is achieved with Zoho Sheet to online create, share and collaborate, with the following advantages:

- Access from anywhere with a browser.
- No software installations.
- Share with friends or the world.
- Allows multiple users to work in the same spreadsheet simultaneously.
- Imports and exports to Excel.
- With macros, VBA and pivot tables.


Goles en Sudáfrica


Now we can start scoring goals together!

Traducción al español aquí.

Cómo meter los goles del mundial

¿Cómo meter los goles del mundial?

Con las herramientas de colaboración en la nube se pueden meter los goles del mundial en una hoja de cálculo y compartirla con todo el mundo.

La más completa colaboración se consigue con Zoho Sheet para crear, compartir y colaborar en modo online, con las siguientes ventajas:
- Acceso desde cualquier lugar con un navegador.
- Sin instalaciones de programas.
- Compartir con amigos o con el mundo.
- Permite que varios usuarios trabajen en la misma hoja de cálculo simultáneamente.
- Importa y exporta a Excel.
- Con macros, VBA y tablas pivote.

Goles en Sudáfrica


¡Ya podemos comenzar a meter goles juntos!

Pero antes tienes que crear una cuenta gratuita en Zoho desde aquí

English translation of this post here.

How to share expenses in the clouds

A few days ago I had breakfast with a news headline of Microsoft:
Office is now live on SkyDrive!
and since then I don't stop posting and sharing files in the cloud.

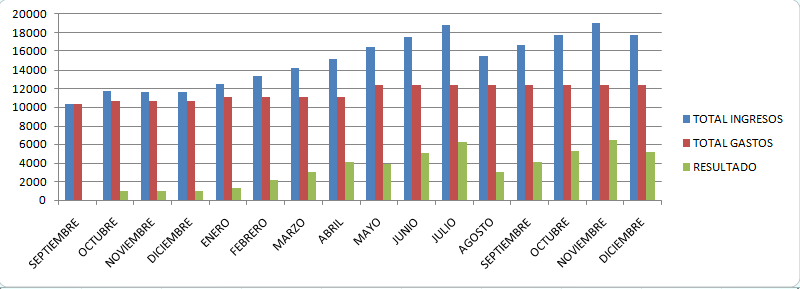
So now that the costs are skyrocketing, and revenues do not therefore, I believe it is a good idea to share it, in times of economic crisis, to tighten our belts all. As usual I have updated my own spreadsheet tracking income and personal expenses, now I have reviewed and updated it to share with you. The truth is that the idea was giving to me by my friend Chandoo on his blog that encourage me to submit to a contest of Excel:

Win a Netbook – 10000 RSS Contest


Do not have Excel 2010 installed?

Do you have a PC with a web browser only?

Do you want to continue working with own and shared files?


The solution is in the cloud!


You can work with spreadsheet data in Windows Live by following these simple steps:

1) Log on Windows Live if you have an account. Haven't you? Create an account now and do not ask me how!

2) You can still use the Web or logging on with a mobile or cell phone.

3) Open from the top menu: Office | Recent documents

4) In your new virtual disk of 25GB SkyDrive, opens: New | Excel Book

5) Give a name to the book and create a file type .xlsx Yes!, Excel 2010 without having installed anything! and click Save.

6) You just create your first Microsoft ExcelWebApp, yes, more limited than the official version but operational! and you can edit it.

7) Edit in the Browser

8) Clicking File, you can open the file in Excel on your PC and to SHARE!!! with your friends in the cloud...

Do not you believe that? Try to share one of my own public Excel files:


Tracker for Personal Expenses and Incomes


NOTICE for Internet users: If you open "a hair" without going into Windows Live session you can only download it and open it in Excel on your PC. If you want to edit it in your browser, click Login (top right).


Finally, Microsoft is in competition with Google docs, Zoho Sheet and other applications in the cloud!

Because look at what makes Google docs with the SUMPRODUCT function in these expenses that I want to share with you in the cloud:


I personally like it better how Zoho Sheet works, which lets you record macros and publish blogs directly as this average daily expenses:


Any application platforms in the cloud has to be improved to incorporate macros, VBA, forms of control, etc., But it is a first step that Microsoft took on 7 June by launching Office Web Apps on Windows Live, and adds there in Microsoft Excel 2010 blog here.

And not only Excel files but also Word, PowerPoint and OneNote files can be published and shared in the cloud now.

Now begins a new era for office software applications for students, homeworkers and professionals!

Traducción al español aquí.

Cómo compartir gastos por las nubes

Hace unos días me desayuné con el titular de Microsoft:
¡Office ahora está vivo en SkyDrive!
y desde entonces no paro de publicar y compartir ficheros en la nube.

Por eso, ahora que los gastos están por las nubes, y los ingresos no tanto, creo que es una buena idea compartirlos en tiempos de crisis económica, para apretarnos el cinturón todos. Como tengo costumbre de actualizar mi propia hoja de cálculo de seguimiento de los ingresos y gastos personales la he revisado y la he puesto al día para compartirla con vosotros. La verdad es que la idea me la dio mi amigo Chandoo en su blog al animarnos a presentarnos a un concurso de Excel:

Win a Netbook – 10000 RSS Contest


¿Que no tienes Excel 2010 instalado?

¿Tienes un PC con un navegador web solamente?

¿Quieres seguir trabajando con archivos propios y compartidos?


¡La solución está en la nube!


Se puede trabajar con datos de hoja de cálculo en Windows Live siguiendo estos sencillos pasos:

1) Inicia sesión en Windows Live ¿no tienes? ¡crea una ya y no me preguntes cómo!

2) Puedes seguir usando la Web o iniciar sesión con un teléfono móvil o celular.

3) Abre en el menú superior: Office | Documentos recientes

4) En tu nuevo disco virtual de 25 GB SkyDrive, abre: Nuevo | Libro de Excel

5) Dale un nombre al libro y se creará uno vacío del tipo .xlsx ¡Sí, es Excel 2010 sin haberlo instalado ni nada! y pulsa Guardar.

6) Acabas de crear tu primer Microsoft ExcelWebApp, eso sí, más limitado que la versión oficial ¡pero operativa! y ya puedes editarlo.

7) Editar en el Explorador

8) Pinchando en Archivo, podrás abrir el archivo en la Excel de tu PC y ¡¡¡COMPARTIRLO!!! con tus amigos en la nube...

¿No te lo crees? Prueba a compartir uno de mis archivos públicos:

Seguimiento de Gastos e Ingresos Personales


AVISO para navegantes: Si los has abierto "a pelo" sin entrar en sesión Windows Live sólo podrás descargártelo y abrirlo con el Excel de tu PC. Si quieres editarlo en tu navegador, pulsa Iniciar sesión (arriba a la derecha)

¡Por fin Microsoft está haciendo la competencia a Google docs, Zoho Sheet y otras aplicaciones en la nube!

Porque mira lo que hace Google docs con la función SUMPRODUCT en estos gastos que quiero compartir contigo en la nube:


A mi personalmente me gusta más cómo trabaja Zoho Sheet, que permite grabar macros y publicar directamente en los blog tu gastos medios diarios:


Cualquiera de las plataformas de aplicaciones en la nube tiene que mejorar para incorporar macros, VBA, formatos de control, etc., pero es un primer paso que Microsoft dio el 7 de junio al lanzar Office Web Apps en Windows Live, como anunció en su blog de Microsoft Excel 2010 aquí.

Y no solo los ficheros de Excel sino también Word, PowerPoint y OneNote se pueden publicar y compartir en la nube desde ahora.

¡Ahora comienza una nueva etapa para las aplicaciones informáticas de oficina, estudiante y profesional del software!

English translation of this post here.

Mi lista de blogs