Traducir el blog

Catch the Ball Game - Juego Atrapa la Bola

Juego Atrapa la Bola

Este juego está totalmente diseñado en Excel con macros VBA y tendrás un minuto para atrapar todas las bolas que puedas mientras van rebotando en un rango rectangular de celdas.

Este minijuego del verano se trata de hacer clic encima de la bola mientras se mueve por una hoja Excel. Las bolas están numeradas y al atrapar una bola aumenta el contador de bolas atrapadas y aparece una nueva bola desde abajo, en cualquier ángulo, y comienza a moverse. Los primeros 30 segundos su velocidad es constante y los últimos 30 segundos va acelerando progresivamente.
Esta es la pantalla del juego:

Catch the Ball Game

This game is fully designed in Excel with VBA macros and you will have one minute to catch as many balls as you can while bouncing on a rectangular cell range.

This summer minigame is all about clicking on the ball while moves through an Excel sheet. The balls are numbered and when catching one ball increases the caught ball counter and a new ball appears from down, at any angle, and begins to move. The first 30 seconds its speed is constant and the last 30 seconds it accelerates progressively.

This is the game screen:


Descargar el juego

Para poder jugar hay que permitir la edición y habilitar las macros.

El juego se puede descargar desde estos dos enlaces:

Download the game

In order to play, you must allow editing and enable macros.

The game can be downloaded from these two links:

Derecho de autor

Yo, Pedro Wave, estoy publicando bajo una Licencia Creative Commons

Atribución-NoComercial-CompartIgual 3.0 No portada (CC BY-NC-SA 3.0) https://creativecommons.org/licenses/by-nc-sa/3.0/

Los términos de la licencia son:

  • Atribución: Otorgue el crédito apropiado, manteniendo mi nombre y el nombre de mi blog en el libro de trabajo y el código.
  • Compartir igual: Si remezcla, transforma o crea a partir del material, debe distribuir su contribución bajo la misma licencia del original.
  • No comercial: Usted no puede hacer uso del material con propósitos comerciales.

Copyright

I, Pedro Wave, am publishing under a Creative Commons License

Attribution-NonCommercial-ShareAlike 3.0 Unported (CC BY-NC-SA 3.0)
https://creativecommons.org/licenses/by-nc-sa/3.0/

Under the following terms:

  • Attribution: You must give appropriate credit to my blog, provide a link to the license, and indicate if changes were made.
  • ShareAlike: If you remix, transform, or build upon the material, you must distribute your contributions under the same license as the original.
  • NonCommercial: You may not use the material for commercial purposes.


Vídeo del juego

Game video


Instrucciones del juego

Si este juego necesita instrucciones, ¡apaga y vámonos!

La única instrucción que vale es abrir el editor de VBA y estudiar el código de las macros para aprender a hacer un juego como éste en Excel.

Cambia la forma de la bola haciendo clic en el título del juego.

Cambia de jugador haciendo clic en uno de los diez mejores jugadores.

Cambia el sonido del juego entre: ON - OFF - ONE (sólo suena cuando atrapas la bola).

Cambia la velocidad de la bola: 1 a 10.

¡Que pases un buen verano!

Game instructions

If this game needs instructions, let's get out of here!

The only instruction that works is to open the VBA editor and study the macro code to learn how to make a game like this in Excel.

Change the shape of the ball by clicking on the game title.

Change the player's name by clicking on one of the top ten players.

Switch the game sound between: ON - OFF - ONE (only sounds when you catch the ball).

Change the ball speed from 1 to 10.

Have a great summer!

Power Query - multiple slicers (4/4)

This is the fourth solution with Power Query to transform a poorly designed table into a pivot table but with multiple repeating rows.

In the following dynamic image you can see the 9 steps applied to transform the table.


Fourth solution

This fourth and last solution doesn't use a generic function, as in the previous solutions, it only uses these 9 steps applied with Power Query, which can be seen in the Advanced Editor:

Below I explain each of these applied steps:

1) Source = Excel.CurrentWorkbook(){[Name="TableDetails"]}[Content]

TableDetails is the original table with the Details column, with the details of the 3 data types listed in the Type column: Locations, Ages & Skills. The rest of columns are names of people with a Y o y to indicate that they are part of a specific detail of one of the data types. For example, Mary has been to two different locations: London & Joburg, which should be considered when pivot the table in the step 7).


2) #"Unpivoted Other Columns" = Table.UnpivotOtherColumns(Source, {"Type", "Details"}, "Name", "Value"),

In this step, the 2 columns on the left (Type & Details) are selected to unpivot the columns with Names, creating a normalized table with 2 additional columns: Name & Value, inserting a row for each pair of values of those columns. Null values don't create new rows. The Table.UnpivotColumns function forces the selected columns to be unpivoted, so the Table.UnpivotOtherColumns function is used, which is independent of the number of columns to be unpivoted, so it is not necessary to select each column with a Name who, a priori, it is not known.


3) #"Removed Columns" = Table.RemoveColumns(#"Unpivoted Other Columns",{"Value"}),

The Value column is not relevant so it is removed. Notice that it contains both the uppercase Y letter and the lowercase y letter, to indicate that a type detail exists for a given name.


4) #"Group Clust Index" = Table.Group( #"Removed Columns",

List.RemoveItems(Table.ColumnNames(#"Removed Columns"),{"Details"}),

{"ColOfTables",each Table.AddIndexColumn(_,"idx")}),

This step is very important because it creates a column composed of "ColOfTables" tables, one for each pair of Type & Name values, with as many rows as there are Details records for each pair of Type & Name values, adding a consecutive index column " idx" to distinguish each row in that table. The 18 rows from above step 3) have been converted to 15 rows in which the Type & Name value pairs are not duplicated.


5) #"Expanded ColOfTables" = Table.ExpandTableColumn(#"Group Clust Index", "ColOfTables",        {"Details", "idx"}, {"Details", "idx"}),

This step expands the values of the tables of the column "ColdOfTables" in two columns: Details & idx (index of each table), so that the 15 rows become 18 rows in this case, being 3 details with the same pair of Type & Name values, and their indices are 0 and 1 respectively.


6) #"Sorted Rows" = Table.Sort(#"Expanded ColOfTables",{{"idx", Order.Ascending}}),

The trick to correctly pivot this table in the next step 7) is that the index column "idx" is in ascending order.


7) #"Pivoted Column" = Table.Pivot(#"Sorted Rows", List.Distinct(#"Sorted Rows"[Type]), "Type",        "Details"),

This step pivots the table by creating 3 Type columns: Ages, Skills & Locations, with their Details values for each Name. It is observed that it is not an ordinary pivot table, as there are duplications in the Name column, discriminated by the index "idx" column.


8) #"Removed Index" = Table.RemoveColumns(#"Pivoted Column",{"idx"}),

Right now you can remove the index "idx" column, as it has already played its role pivoting the table with repeated names into the several rows.


9) #"Filled Down" = Table.FillDown(#"Removed Index",{"Locations", "Ages", "Skills"})

This last step fills in the nulls with the values on the above row that correspond to the same Name.


This fourth solution allows you to see the result of each step applied in the Power Query Editor, which is not elementary with a generic function, since it applies all the steps without being able to see what each step does with the tables tranformation. This solution also makes it easier to copy these steps in M language code from the Power Query Advanced Editor to paste it into another Excel workbook or even into Power BI.

These 9 steps are a good example that Power Query is an excellent ETL tool to Extract, Transform & Load. An additional loading step is done just before closing the Power Query Editor, choosing to load the transformed table as a normal Excel table.

It is possible to insert in this table 3 slicers, one for Locations, another for Ages and another for Skills, as it was intended to achieve in the statement of the problem that was raised in this forum:

MrExcel.com - multiple slicers
I have a table of data with locations, ages, and skills in the left hand column. Can a slicer be set up for each data type? ie one for the locations, one for the ages, and one for the skills.


Fourth solution download

  • From this link to Microsoft OneDrive:

Multiple Slicers PW4.xlsx

  • From this link to Sites Google Drive:

Multiple Slicers PW4.xlsx


This post completes the 4 solutions proposed to solve this problem, which I hope will help my readers to start and experiment with Power Query, with all its potential as an ETL tool, which allows solving complex problems without the need to program avanced Excel formulas and/or macros VBA.

Power Query - multiple slicers (3/4)

In the previous post we saw a generic function that allows you to pivot a table in multiple rows:

Power Query - multiple slicers (2/4)

In this post we will see a second version of that generic function, as published by Cameron Wallace on GitHub:

camwally / Power-Query / fNonAggPivotMultRows2.pq


Third solution

This solution has its origin in the normalized detail table and, applying the generic function, it becomes a pivoted table with multiple rows if there is more than one location, age or skill per person.

This case cannot be solved with dynamic tables, since they do not admit several rows with the same Name.

The M code in Power Query for the generic function that pivot the table is as follows:

The way to call this function is:

= #"Pivot Duplicates Function"(TableDetails, "Type", "Details")

3 arguments are passed: Source as table, PivotCol as text and ValueCol as text.

The 5 steps applied by the generic function are explained below:

1) Source = Table.Buffer(Source)

//As source table is referenced 3 times, buffers the Source table in memory, isolating it from external changes during evaluation.

2) GroupClustIndex = Table.Group(Source,

List.RemoveItems(Table.ColumnNames(Source),{ValueCol}),

{"ColOfTables",each Table.AddIndexColumn(_,"idx")})

//Groups rows in the table that have the same key with List.RemoveItems function, adding an index column called "ColOfTables".

3) CombineTables = Table.Combine(GroupClustIndex[ColOfTables])

//Combine main table with the tables in the "ColOfTables" column.

4) Pivot = Table.Pivot(CombineTables,

List.Distinct(Table.Column(Source,PivotCol)), PivotCol, ValueCol)

//Pivot Source tabla with the PivotCol adding one column for each "Type" with the ValueCol from "Details" values. 

5) RemoveIndex = Table.RemoveColumns(Pivot,{"idx"})

//Remove auxiliar index.


Third solution download

  • From this link to Microsoft OneDrive:

Multiple Slicers PW3.xlsx

  • From this link to Sites Google Drive:

Multiple Slicers PW3.xlsx


With the generic function, you cannot click individual steps and see how the query transforms the data, so a fourth solution is required.

You can read the following post talking about the last fourth solution, without the generic function and with only a few steps applied in Power Query:

Power Query - multiple slicers (4/4)

Power Query - multiple slicers (2/4)

In the second solution to the problem of being able to insert multiple slicers in a table, we just use Power Query to solve it, being the first query equal to that of the first proposed solution: unpivoting other columns.

You can read how to unpivot the original table in this link:


Second solution

The second query with Power Query is based on the following article:

Dingbat Data - Non-aggregate pivot with multiple rows in Power Query

Cameron Wallace published in that post a generic function that solves the case there are multiple detail values for the same data type and the same person.

The generic function in Power Query looks like this:

As source, we start from the unpivoted table (TableDetails) and pass two arguments: the column to pivot (Type) and the column with the values (Details).

To understand it, TableDetails is a normalized table with 3 columns that cannot be pivoted in the usual way, as it contains multiple values of detail for the same name and type, so it will be necessary to create additional rows when this table is pivoted:

For example, Mary has lived in two different locations: London and Joburg, so it takes 2 rows to pivot that data.

For this, the Pivot Duplicates Function has been defined with this Power Query M code:

I am not going to explain these M formulas in detail because they are not mine and are explained in the blog where this function was originally published (link here). In a next post I'll publish the fourth proposed solution, where I'll explain some of these formulas.

The way to call this function is:

= #"Pivot Duplicates Function"(TableDetails, "Type", "Details")

With which the TableDetails with its Details is pivoted by the Type, resulting in the following table:

For each Name of a person, one or more rows are obtained with all their Locations, Ages & Skills.

Null values indicate that this value is the one in the previous row, so the next step is to fill those values down with this function:

= Table.FillDown(Source,{"Locations", "Ages", "Skills"})

With which the desired second solution is achieved:

Now multiple slicers can be inserted into this table, as requested in the initial forum query.


Second solution download

  • From this link to Microsoft OneDrive:

Multiple Slicers PW2.xlsx

  • From this link to Sites Google Drive:

Multiple Slicers PW2.xlsx


I've posted the third solution with a simplified version of the generic function that has been used in this second solution. Access it at the following link:

Power Query - multiple slicers (3/4)

Power Query Table to set up multiple slicers

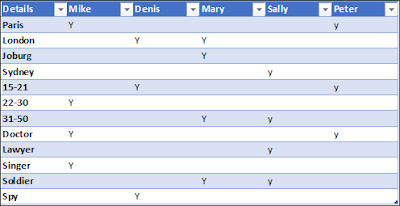
A week ago I answered a question from the forum MrExcel.com asking for help creating multiple slicers for a table like this:


MrExcel.com - multiple slicers
I have a table of data with locations, ages, and skills in the left hand column. Can a slicer be set up for each data type? ie one for the locations, one for the ages, and one for the skills.

The problem is that locations, ages and skills are in the same column, so slicers cannot be created for those data types with a table that is not normalized.

If the table were normalized it would be very easy to insert slicers. For example in this table:

When the data layout is all in column A, as in the first table, we need to transform that table to get a table with a column for each type of data: locations, ages and skills.


Transformations

First of all, it is necessary to indicate what type of data is in each row of the original table, including a new column on the left for the data types, as in the following table:

With this new column, it is perfectly determined what type of data each detail corresponds to, something that humans find easy to associate because we have natural intelligence, but that machines and spreadsheets find it impossible without artificial intelligence, and we have to give them concrete ideas, so they can associate each field with data to its specific entity.

Below I explain my human logic used to try to solve this problem. In this post I am going to propose 4 possible solutions to this problem, following the flow of my reasoning, as I try more formulas in Power Query M language.

All the 4 proposed solutions go through unpivot columns thanks to the Power Query tool (link here).


First solution

I use Power Query to select the Type and Details columns and unpivot other columns with each person's data. Also I insert a new merged column: Name-Type. This is the result:

With the previous table as a data source, I have inserted a dynamic table (left) and an auxiliary table with formulas (right), which will need to be adjusted in size each time the source data is updated:

One more pivot table must be created with data source in the auxiliary table and finally the slicers are created:


First solution download

  • From this link to Microsoft OneDrive:

Multiple Slicers PW1.xlsx

  • From this link to Sites Google Drive:

Multiple Slicers PW1.xlsx

In this file you can analyze:

  • Power Query M code

The main M function is Table.UnpivotOtherColumns, which allows unpivot other non-selected columns, in this case the people names as "Attribute":

Univot data is more complicated with VBA than with Power Query. See VBA code to unpivot data here.

  • Auxiliary table formulas, as in F2 cell:
  • Pivot tables with slicers as the above image.

You can read the second solution to this problem here:

Power Query - multiple slicers (2/4)

Mi lista de blogs