Users perceive
colors by the sense of sight and you can't believe your eyes, can you?
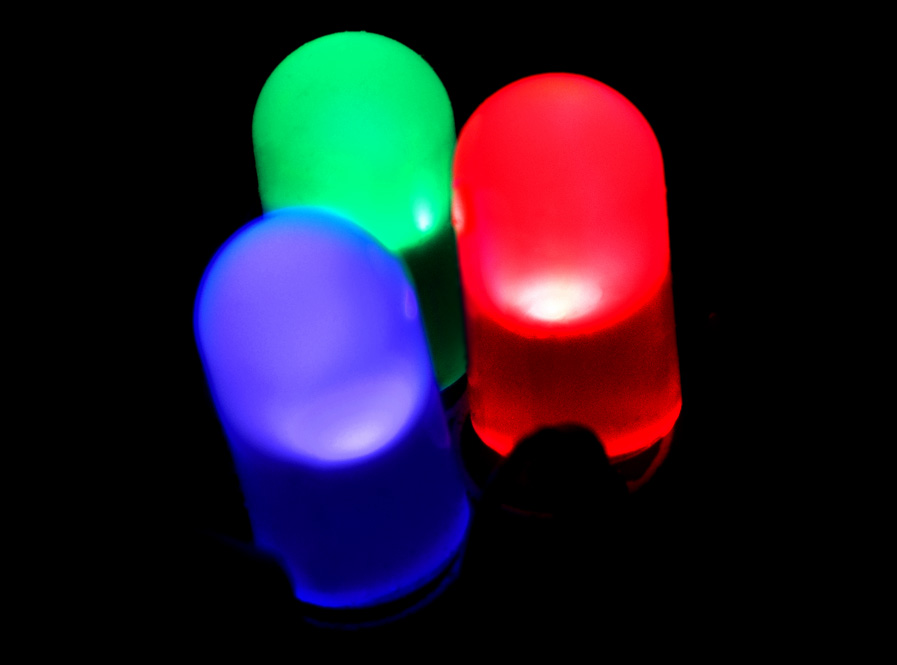
In a modern monitor,
LCD or
LED type, the images are formed by the additive mixture from the basic colors Red (R), Green (G) and Blue (B), so technically known as the
RGB color model.
The cone cells in our eyes are sensitive to colors. There are three specialized types in each of the basic colors. The green and red are seen with the same intensity, but the blue is perceived as one twentieth (1/20), wich allows the compression of images and videos in
JPEG and
MPEG formats, reducing the blue component without appreciating a substantial loss quality. But everything depends on having the sense of sight as much or little developed as those good painters, for whom this loss is important. The opposite occurs in those with
color blindness and in severe cases come to confuse red and green, although they can see more shades of purple that people with normal vision and are able to distinguish some hidden objects.
The levels of RGB for each color grade ranging from minimum 0 to maximum brightness level of 255, so a single point of light can be altered by 16,777,216 (256x256x256) different values of RGB, from (0,0,0) to (255,255,255), which is sufficient for 24-bit monitors, but they tend to be 32 bits, up to 4,294,967,296 colors (although usually 8 bits per RGB value and 8 bit alpha transparency, depending on the graphics card . To do this using other color models such as
CMYK (for its initials in English Cyan Magenta Yellow blacK) with different color depths. The colors of the web pages as you're seeing now are generated using
HTML color codes representing their respective RGB values.
In short, that "nothing is truth, nothing is lie, it all depends on the
eye of the beholder", but what is not acceptable is that the professionals of user-centered design use a non-standard and variable color palette and not follow the technical and legal requirements officially established. And it occurs more often than it should be by negligence or by the damn hurry.
As a little colorful exercise, I'm attaching three Excel sheets with the flags of
India,
Spain and
Europe, with the official colors of their respective countries:
The
Royal Decree 441/1981 of 27 February, technically specifies the
colors of the Spanish Flag:
| Color | Color Name | Tone ºH | Croma C | Lightness L |
|---|
| Yellow | Flag Weld-Yellow | 85.0 | 95.0 | 80.0 |
| Red | Flag Red | 35.0 | 70.0 | 37.0 |
And it also indicates a tolerance of 5 CIELAB units, so
the Spanish Flag is made of more than two colors, as many as drapes and shapes of the pieces of cloth with which hardens the skin of a bull that is Spain.
For those of you that do not have a professional drawing program and need to convert colors in different models, you can visit
The Coloring Pages that I used to so not to confuse between amalgam of all colors.
Traducción al español
aquí.


2 Response to "Color's chart"
Buenos dias mi nombre es Juan, les escribo porque me gustaría un poco de ayuda del a mi problema. En una hoja de Excel he añadido un gráfico y tiene a su vez que he creado un reloj análogo que funciona bien. El problema se encuentra en el hecho de que en lugar de los clásicos números que componen las horas y minutos del día. He añadido diamantes blancos. Ahora deseo a cada extremo de los cinco minutos, el diamante, que corresponde a ese minuto que revela roja. Cómo puedo obtener todo esto; Además me gustaría que fuera no sólo técnica sino también práctica, por lo que puedo entender todos los pasos que se han creado para llevar a cabo estas acciones. Ya que no tengo mucha práctica con estas carta gracias de antemano por cualquier ayuda que me va a dar Saludos sinceros desde Maurizio a.
Hola Maurizio,
Tu solicitud de ayuda la puedes dirigir al grupo de usuarios del Foro de AyudaExcel
que te atenderán muy bien si subes un ejemplo de tu plantilla como la tengas preparada, explicando lo que quieres conseguir.
Es totalmente gratis hacerte usuario y hacer preguntas y ayudar a la comunidad de usuarios de Excel.
Un saludo,
pedrowave
Leave A Reply
Comenta este artículo, critícalo o avisa si detectas algún error que haya que corregir.